Pegisai Global Holdings. Published 17 September 2026. The Alkaimi Government Solvency Index™ (AGSI™) and the Productive Coverage Ratio are not recomputed here; the May 2026 values stand until the September computation of the AGSI is published.
What the ACVI is
The Alkaimi Currency Value Index™ scores the governmental system behind a currency from 0 to 100. Seven factors are each scored between 0 and 1 and multiplied: fiscal discipline, monetary solvency, settlement integrity, asset coverage, military sustainability, revenue extraction architecture, and citizen asset seizure. Multiplication means a terminal failure in one dimension cannot be offset by strength in another. Every input is drawn from a named public source and dated. Any reader can identify the input in dispute and produce an alternative figure from a named alternative source.
The method
Both columns in this report are computed on the current formula. The May 2026 column is recomputed on that formula from the data current to April 2026 and supersedes the May 2026 table as published, which was computed on an earlier method. The September column applies the same formula to the data current to August 2026. A change between the two columns is therefore a change in the data, not in the method.
ACVI™ = 100 × F_fiscal × F_monetary × F_settlement × F_coverage × F_military × F_tax × F_bailin. F_fiscal = [1 − min(Debt/GDP ÷ 1.5, 0.90)] × [1 − min(Deficit/GDP, 0.30)], floor 0.10. F_monetary = [1 − min((M2/GDP − 0.50) ÷ 2.0, 0.85)] × [1 − min(M2 growth − real GDP growth, 0.25)], floor 0.15, with M2 over the real GDP of the same year, in constant local prices, as the formula brief states. F_coverage = min(verified hard assets ÷ M2, 1.00)^0.5, floor 0.05, hard assets being central bank gold at 143,169 dollars per kilogram, sovereign wealth fund assets at 70 percent, and state-owned hydrocarbon reserves at 50 percent; foreign exchange reserves are not hard assets. F_military = F_capability × F_sustainability, with F_sustainability = 1 − min(Defense/GDP ÷ 0.10, 0.50) × (1 − F_fiscal) × (1 − F_monetary), and F_capability at 1.00 for every assessed sovereign. F_settlement, F_tax and F_bailin are the categorical scales of the formula document, assigned in Table 3.
Conventions common to both columns: the gold price of 143,169 dollars per kilogram, so that the comparison shows holdings and money, not the gold price; sovereign wealth fund assets from the Global SWF ranking of September 2026; defense spending for 2025 from SIPRI; the categorical scores of Table 3. Conventions particular to each column: the May column uses the 2025 debt, deficit and growth of the IMF World Economic Outlook of April 2026, money supply at April 2026 over real GDP of 2025, gold at the reference month then reported, and Brent at 114.66 dollars on 30 April 2026; the September column uses the 2026 debt, deficit and growth of the same Outlook, money supply at July or August 2026 over real GDP of 2026, gold at the latest reference month, and Brent at 93.03 dollars on 31 August 2026. Exchange rates: the ECB reference rates of 31 August 2026 for the currencies the ECB quotes, the Gulf pegs at their fixed rates, and the ruble, the Egyptian pound and the Pakistani rupee at their 2025 average rates. Mineral reserves are not included for want of a uniform source; the omission understates coverage for Russia, China, India and Brazil. Real GDP is the World Bank's constant local currency series at each country's national base year, and Eurostat's euro area series at 2020 prices.
The result
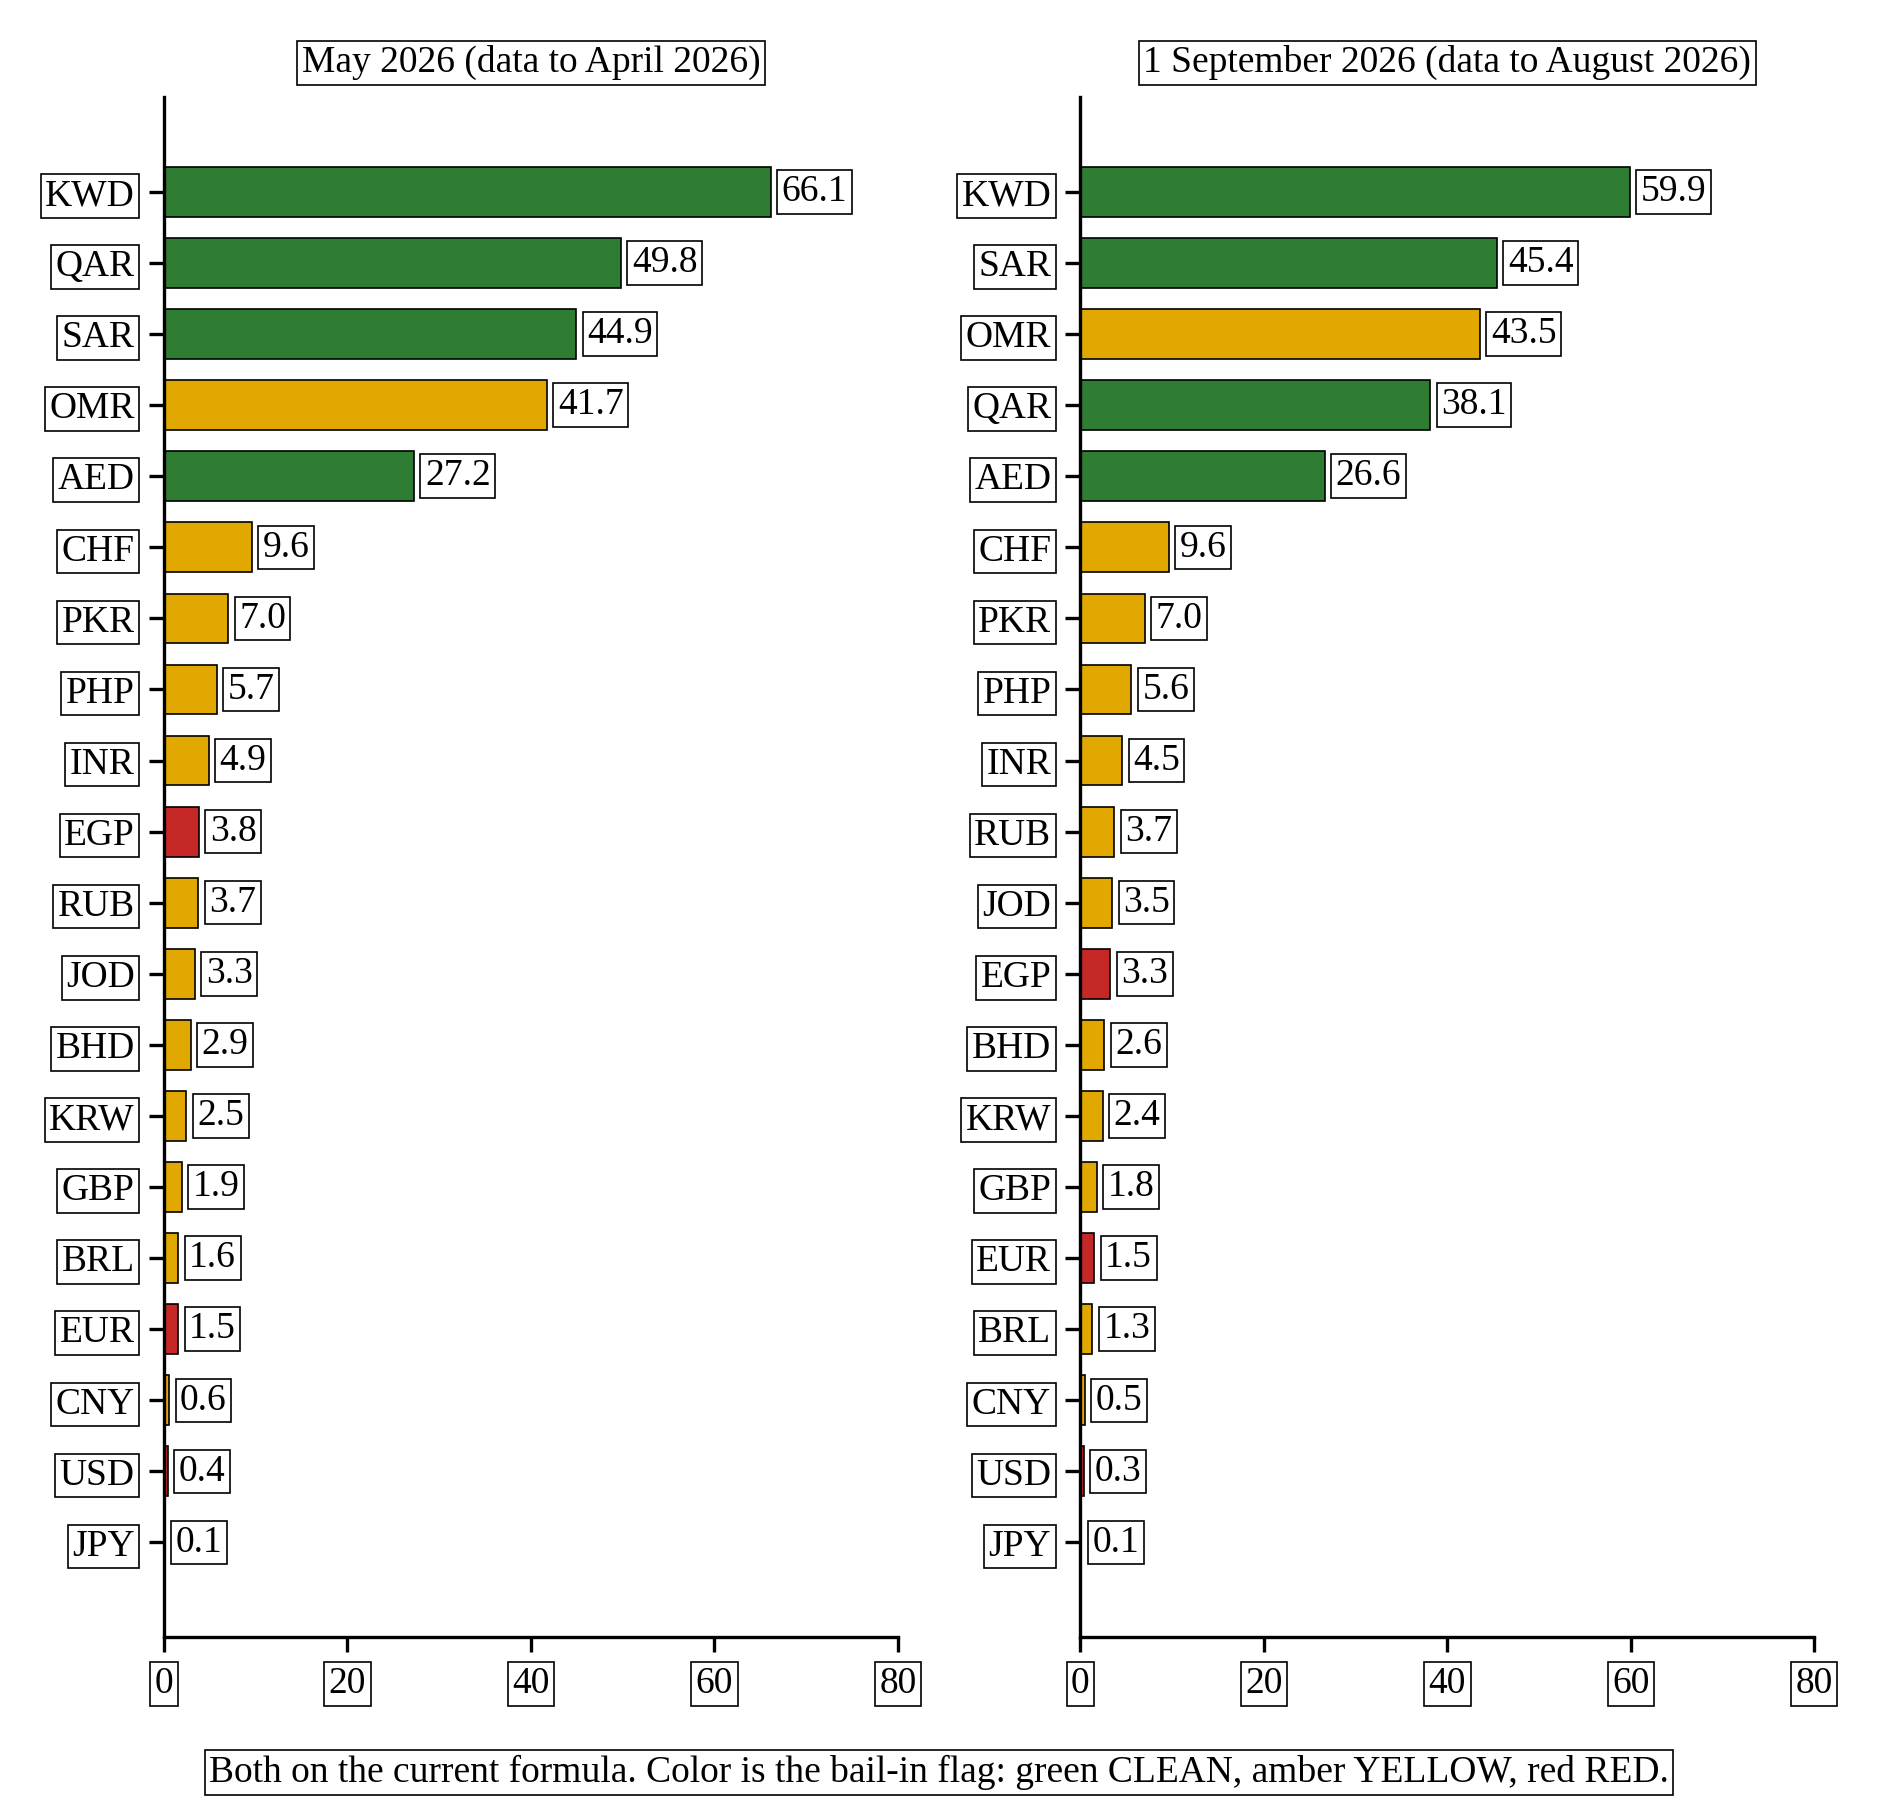
Figure 1. Left, the ACVI of the twenty at May 2026 on the current formula, data to April 2026. Right, the ACVI at 1 September 2026, data to August 2026. Both sorted, both on the same scale. The color is the bail-in flag.
On one method the two columns are close for most of the twenty. The largest movements are Qatar, down 11.7 points to 38.1 on a 2026 contraction of 8.6 percent and a wider deficit; Kuwait, down 6.3 to 59.9 on debt rising from 14.6 to 22.3 percent of GDP and growth turning negative; Oman, up 1.8 to 43.5 on a larger surplus and falling debt; Egypt, down 0.5 to 3.3 on the wider deficit and the lower oil price; and Brazil, down 0.3 to 1.3 on the lower oil price behind its coverage. The five primary reserve currencies score below 2.0 in both columns.
| Code | Country | May 2026 | 1 Sept 2026 | Change | Bail-in flag |
|---|---|---|---|---|---|
| KWD | Kuwait | 66.1 | 59.9 | -6.3 | CLEAN |
| SAR | Saudi Arabia | 44.9 | 45.4 | +0.4 | CLEAN |
| QAR | Qatar | 49.8 | 38.1 | -11.7 | CLEAN |
| AED | United Arab Emirates | 27.2 | 26.6 | -0.6 | CLEAN |
| OMR | Oman | 41.7 | 43.5 | +1.8 | YELLOW |
| CHF | Switzerland | 9.6 | 9.6 | +0.1 | YELLOW |
| EUR | Euro area | 1.5 | 1.5 | -0.0 | RED |
| GBP | United Kingdom | 1.9 | 1.8 | -0.2 | YELLOW |
| INR | India | 4.9 | 4.5 | -0.3 | YELLOW |
| KRW | South Korea | 2.5 | 2.4 | -0.0 | YELLOW |
| JPY | Japan | 0.1 | 0.1 | +0.0 | YELLOW |
| CNY | China | 0.6 | 0.5 | -0.1 | YELLOW |
| USD | United States | 0.4 | 0.3 | -0.0 | RED |
| BHD | Bahrain | 2.9 | 2.6 | -0.3 | YELLOW |
| JOD | Jordan | 3.3 | 3.5 | +0.1 | YELLOW |
| EGP | Egypt | 3.8 | 3.3 | -0.5 | RED |
| PKR | Pakistan | 7.0 | 7.0 | +0.0 | YELLOW |
| PHP | Philippines | 5.7 | 5.6 | -0.2 | YELLOW |
| BRL | Brazil | 1.6 | 1.3 | -0.3 | YELLOW |
| RUB | Russia | 3.7 | 3.7 | -0.1 | YELLOW |
Table 1a. The ACVI at May 2026 and at 1 September 2026, both on the current formula. The flag is the bail-in flag carried from the May table.
| Code | Fiscal | Monetary | Settlement | Coverage | Military | Tax | Bail-in |
|---|---|---|---|---|---|---|---|
| KWD | 0.85 | 0.72 | 1.00 | 1.00 | 0.98 | 1.00 | 1.00 |
| SAR | 0.76 | 0.87 | 1.00 | 1.00 | 0.98 | 0.70 | 1.00 |
| QAR | 0.69 | 0.59 | 1.00 | 1.00 | 0.94 | 1.00 | 1.00 |
| AED | 0.79 | 0.42 | 1.00 | 1.00 | 0.94 | 0.85 | 1.00 |
| OMR | 0.78 | 0.79 | 1.00 | 1.00 | 0.98 | 0.85 | 0.85 |
| CHF | 0.74 | 0.55 | 1.00 | 0.33 | 0.99 | 0.85 | 0.85 |
| EUR | 0.40 | 0.61 | 0.60 | 0.28 | 0.95 | 0.55 | 0.70 |
| GBP | 0.30 | 0.58 | 0.87 | 0.21 | 0.93 | 0.70 | 0.85 |
| INR | 0.41 | 0.72 | 0.75 | 0.35 | 0.96 | 0.70 | 0.85 |
| KRW | 0.63 | 0.33 | 0.87 | 0.24 | 0.94 | 0.70 | 0.85 |
| JPY | 0.10 | 0.16 | 1.00 | 0.12 | 0.89 | 0.70 | 0.85 |
| CNY | 0.26 | 0.15 | 0.75 | 0.29 | 0.89 | 0.70 | 0.85 |
| USD | 0.15 | 0.77 | 0.60 | 0.31 | 0.94 | 0.85 | 0.20 |
| BHD | 0.10 | 0.68 | 0.87 | 0.81 | 0.91 | 0.70 | 0.85 |
| JOD | 0.43 | 0.65 | 0.60 | 0.38 | 0.91 | 0.70 | 0.85 |
| EGP | 0.37 | 0.34 | 0.75 | 0.92 | 0.97 | 0.70 | 0.55 |
| PKR | 0.52 | 0.65 | 0.60 | 0.61 | 0.95 | 0.70 | 0.85 |
| PHP | 0.58 | 0.77 | 0.60 | 0.35 | 0.99 | 0.70 | 0.85 |
| BRL | 0.33 | 0.41 | 0.45 | 0.66 | 0.96 | 0.40 | 0.85 |
| RUB | 0.86 | 0.53 | 0.25 | 1.00 | 0.97 | 0.40 | 0.85 |
Table 1b. The seven factors at 1 September 2026. Military is F_sustainability, capability at 1.00. The ACVI is 100 times the product of the seven.
| Code | Fiscal | Monetary | Settlement | Coverage | Military | Tax | Bail-in |
|---|---|---|---|---|---|---|---|
| KWD | 0.90 | 0.74 | 1.00 | 1.00 | 0.99 | 1.00 | 1.00 |
| SAR | 0.74 | 0.88 | 1.00 | 1.00 | 0.98 | 0.70 | 1.00 |
| QAR | 0.72 | 0.72 | 1.00 | 1.00 | 0.96 | 1.00 | 1.00 |
| AED | 0.77 | 0.44 | 1.00 | 1.00 | 0.94 | 0.85 | 1.00 |
| OMR | 0.76 | 0.78 | 1.00 | 1.00 | 0.97 | 0.85 | 0.85 |
| CHF | 0.74 | 0.55 | 1.00 | 0.33 | 0.99 | 0.85 | 0.85 |
| EUR | 0.41 | 0.62 | 0.60 | 0.28 | 0.95 | 0.55 | 0.70 |
| GBP | 0.30 | 0.58 | 0.87 | 0.23 | 0.93 | 0.70 | 0.85 |
| INR | 0.41 | 0.72 | 0.75 | 0.38 | 0.96 | 0.70 | 0.85 |
| KRW | 0.64 | 0.33 | 0.87 | 0.24 | 0.94 | 0.70 | 0.85 |
| JPY | 0.10 | 0.16 | 1.00 | 0.12 | 0.89 | 0.70 | 0.85 |
| CNY | 0.31 | 0.15 | 0.75 | 0.30 | 0.90 | 0.70 | 0.85 |
| USD | 0.16 | 0.77 | 0.60 | 0.33 | 0.94 | 0.85 | 0.20 |
| BHD | 0.10 | 0.72 | 0.87 | 0.85 | 0.92 | 0.70 | 0.85 |
| JOD | 0.42 | 0.64 | 0.60 | 0.39 | 0.90 | 0.70 | 0.85 |
| EGP | 0.39 | 0.34 | 0.75 | 1.00 | 0.98 | 0.70 | 0.55 |
| PKR | 0.49 | 0.65 | 0.60 | 0.65 | 0.95 | 0.70 | 0.85 |
| PHP | 0.58 | 0.77 | 0.60 | 0.36 | 0.99 | 0.70 | 0.85 |
| BRL | 0.35 | 0.42 | 0.45 | 0.73 | 0.96 | 0.40 | 0.85 |
| RUB | 0.85 | 0.54 | 0.25 | 1.00 | 0.97 | 0.40 | 0.85 |
Table 1c. The seven factors at May 2026 on the current formula, data to April 2026.
The inputs
| Code | Debt, % of GDP, 2026 | Deficit, % of GDP, 2026 | Real growth 2026, % | Money supply, latest (local) | Growth y/y, % | M2 / real GDP, % |
|---|---|---|---|---|---|---|
| KWD | 22.3 | 0.0 | -0.6 | 43 bn KWD M2, Jul 2026 | 1.9 | 103 |
| SAR | 32.1 | 3.5 | 3.1 | 3,382 bn SAR M3, Jun 2026 | 8.2 | 67 |
| QAR | 43.3 | 3.4 | -8.6 | 775 bn QAR M2, Jul 2026 | 3.5 | 115 |
| AED | 31.4 | 0.0 | 3.1 | 2,900 bn AED M2, Jul 2026 | 19.0 | 150 |
| OMR | 32.7 | 0.0 | 3.5 | 29 bn OMR M2, Jul 2026 | 14.9 | 72 |
| CHF | 38.5 | 0.0 | 1.3 | 1,117 bn CHF M2, Jul 2026 | 4.2 | 137 |
| EUR | 87.8 | 3.3 | 1.1 | 16,436 bn EUR M2, Jul 2026 | 4.4 | 123 |
| GBP | 103.6 | 3.9 | 0.8 | 3,299 bn GBP M4, Jul 2026 | 2.6 | 131 |
| INR | 83.4 | 7.4 | 6.5 | 320,000 bn INR M3, Aug 2026 | 14.2 | 93 |
| KRW | 54.4 | 1.5 | 1.9 | 4,252,581 bn KRW M2, Jul 2026 | 6.6 | 180 |
| JPY | 204.4 | 2.0 | 0.7 | 1,296,390 bn JPY M2, Aug 2026 | 0.6 | 218 |
| CNY | 106.9 | 8.2 | 4.4 | 356,808 bn CNY M2, Aug 2026 | 7.5 | 254 |
| USD | 125.8 | 7.5 | 2.3 | 23,218 bn USD M2, Jul 2026 | 5.4 | 90 |
| BHD | 152.4 | 10.6 | -0.5 | 15 bn BHD M2, Jul 2026 | 10.2 | 98 |
| JOD | 81.8 | 5.4 | 2.7 | 50 bn JOD M2, Jul 2026 | 6.1 | 116 |
| EGP | 87.0 | 12.1 | 4.2 | 15,500 bn EGP M2, Jul 2026 | 17.5 | 171 |
| PKR | 70.1 | 3.2 | 3.6 | 45,635 bn PKR M2, Jul 2026 | 15.7 | 101 |
| PHP | 60.2 | 3.7 | 4.1 | 20,520 bn PHP M3, Jul 2026 | 10.3 | 85 |
| BRL | 96.5 | 7.7 | 1.9 | 7,738 bn BRL M2, Jul 2026 | 9.8 | 160 |
| RUB | 19.1 | 2.0 | 1.1 | 135,683 bn RUB M2, Jul 2026 | 13.0 | 131 |
Table 2a. Fiscal and monetary inputs at 1 September 2026. Debt, deficit and growth: IMF World Economic Outlook, April 2026 vintage, 2026 values. Money supply: the central bank's series at the month shown (M2 where published; M3 for Saudi Arabia, India and the Philippines; M4 for the United Kingdom); growth over the same month a year earlier where the central bank publishes it, otherwise the World Bank's latest annual rate. M2 over the real GDP of 2026, constant local prices, per the formula brief.
| Code | Gold, tonnes (reference) | SWF assets, USD bn | State hydrocarbons at 31 Aug 2026 prices, USD bn | Coverage ratio | Defense, % of GDP, 2025 |
|---|---|---|---|---|---|
| KWD | 79 (Dec 2025) | 1,002 | 9,665 | 39.67 | 4.7 |
| SAR | 323 (Mar 2026) | 1,021 | 25,761 | 15.12 | 6.5 |
| QAR | 49 (Mar 2026) | 580 | 4,662 | 12.89 | 6.5 |
| AED | 48 (Dec 2025) | 2,829 | 11,108 | 9.55 | 5.6 |
| OMR | 17 (Dec 2025) | 60 | 566 | 4.30 | 5.7 |
| CHF | 1,040 (Dec 2025) | 0 | 0 | 0.11 | 0.8 |
| EUR | 10,259 (members' latest, Dec 2025 to Mar 2026) | 0 | 0 | 0.08 | 2.0 |
| GBP | 310 (Dec 2025) | 51 | 250 | 0.05 | 2.4 |
| INR | 881 (Mar 2026) | 5 | 587 | 0.13 | 2.3 |
| KRW | 104 (Dec 2025) | 232 | 1 | 0.06 | 2.6 |
| JPY | 846 (Dec 2025) | 0 | 6 | 0.02 | 1.4 |
| CNY | 2,387 (Aug 2026, SAFE) | 3,614 | 3,069 | 0.08 | 1.7 |
| USD | 8,133 (Mar 2026) | 0 | 2,154 | 0.10 | 3.1 |
| BHD | 5 (Dec 2025) | 18 | 27 | 0.65 | 3.1 |
| JOD | 70 (Dec 2025) | 0 | 1 | 0.15 | 4.6 |
| EGP | 127 (Mar 2026) | 2 | 483 | 0.84 | 0.6 |
| PKR | 65 (Dec 2025) | 0 | 104 | 0.38 | 2.9 |
| PHP | 199 (Mar 2026) | 2 | 23 | 0.13 | 1.3 |
| BRL | 130 (Mar 2026) | 2 | 1,246 | 0.43 | 1.1 |
| RUB | 2,336 (Mar 2026) | 193 | 10,068 | 3.36 | 7.5 |
Table 2b. Asset and defense inputs at 1 September 2026. Gold: IMF International Financial Statistics as compiled by the World Gold Council, China at August 2026 (SAFE), valued at 143,169 dollars per kilogram. Sovereign wealth funds: Global SWF ranking, September 2026, United States federal only. Hydrocarbons: EIA proven reserves, Brent 93.03 dollars per barrel and Henry Hub 2.87 dollars per million BTU, the state's share (25 percent federal for the United States, whole elsewhere), before the 50 percent discount. Coverage: hard assets after the discounts over M2 in dollars at 31 August 2026 rates. Defense: SIPRI, April 2026 (Qatar 2022 and the Emirates 2014, the last available).
| Code | Debt, % of GDP, 2025 | Deficit, % of GDP, 2025 | Real growth 2025, % | Money supply at April 2026 (local) | Growth, % | M2 / real GDP, % | Gold, tonnes | State hydrocarbons at 30 Apr 2026 prices, USD bn | Coverage ratio |
|---|---|---|---|---|---|---|---|---|---|
| KWD | 14.6 | 0.0 | 3.5 | 43 bn | 1.9 | 102 | 79 | 11,871 | 47.79 |
| SAR | 31.7 | 5.8 | 4.5 | 3,316 bn | 8.2 | 68 | 323 | 31,536 | 18.69 |
| QAR | 41.4 | 1.0 | 2.8 | 768 bn | 3.5 | 104 | 49 | 5,202 | 14.28 |
| AED | 34.3 | 0.0 | 5.8 | 2,777 bn | 19.0 | 148 | 48 | 13,552 | 11.59 |
| OMR | 35.8 | 0.0 | 2.4 | 28 bn | 14.9 | 72 | 17 | 683 | 5.25 |
| CHF | 39.4 | 0.0 | 1.3 | 1,106 bn | 4.2 | 137 | 1,040 | 0 | 0.11 |
| EUR | 87.1 | 3.0 | 1.4 | 16,304 bn | 3.9 | 123 | 10,259 | 0 | 0.08 |
| GBP | 102.3 | 5.4 | 1.3 | 3,278 bn | 2.6 | 132 | 310 | 304 | 0.05 |
| INR | 84.1 | 7.4 | 7.6 | 306,146 bn | 14.2 | 95 | 881 | 692 | 0.15 |
| KRW | 52.3 | 1.4 | 1.0 | 4,185,172 bn | 6.6 | 181 | 104 | 1 | 0.06 |
| JPY | 206.5 | 1.1 | 1.2 | 1,293,807 bn | 0.6 | 219 | 846 | 7 | 0.02 |
| CNY | 99.2 | 7.9 | 5.0 | 348,310 bn | 7.5 | 259 | 2,313 | 3,631 | 0.09 |
| USD | 123.9 | 6.8 | 2.1 | 22,757 bn | 5.4 | 90 | 8,133 | 2,554 | 0.11 |
| BHD | 147.6 | 13.0 | 3.1 | 15 bn | 10.2 | 95 | 5 | 31 | 0.72 |
| JOD | 82.8 | 6.3 | 2.7 | 49 bn | 6.1 | 118 | 70 | 1 | 0.15 |
| EGP | 86.8 | 6.6 | 4.4 | 14,887 bn | 17.5 | 171 | 127 | 554 | 0.99 |
| PKR | 72.8 | 5.4 | 3.1 | 44,001 bn | 15.7 | 101 | 65 | 115 | 0.42 |
| PHP | 59.4 | 4.0 | 4.4 | 20,023 bn | 10.3 | 86 | 199 | 26 | 0.13 |
| BRL | 93.3 | 8.1 | 2.3 | 7,559 bn | 9.8 | 160 | 130 | 1,527 | 0.54 |
| RUB | 17.2 | 3.9 | 1.0 | 131,600 bn | 13.0 | 128 | 2,336 | 11,322 | 3.86 |
Table 2c. The inputs of the May 2026 column: debt, deficit and growth for 2025 from the IMF World Economic Outlook of April 2026; money supply at April 2026 on the same series as Table 2a, taken from the ECB (euro area) and FRED (United States) at April 2026 and, for the other eighteen, the July or August 2026 level deflated to April at the year-on-year rate, that rate carried as the growth input; real GDP of 2025, constant local prices; gold at the reference month reported (China 2,313 tonnes at March 2026); hydrocarbons at Brent 114.66 dollars on 30 April 2026; sovereign wealth funds and defense as in Table 2b.
Shifts in position
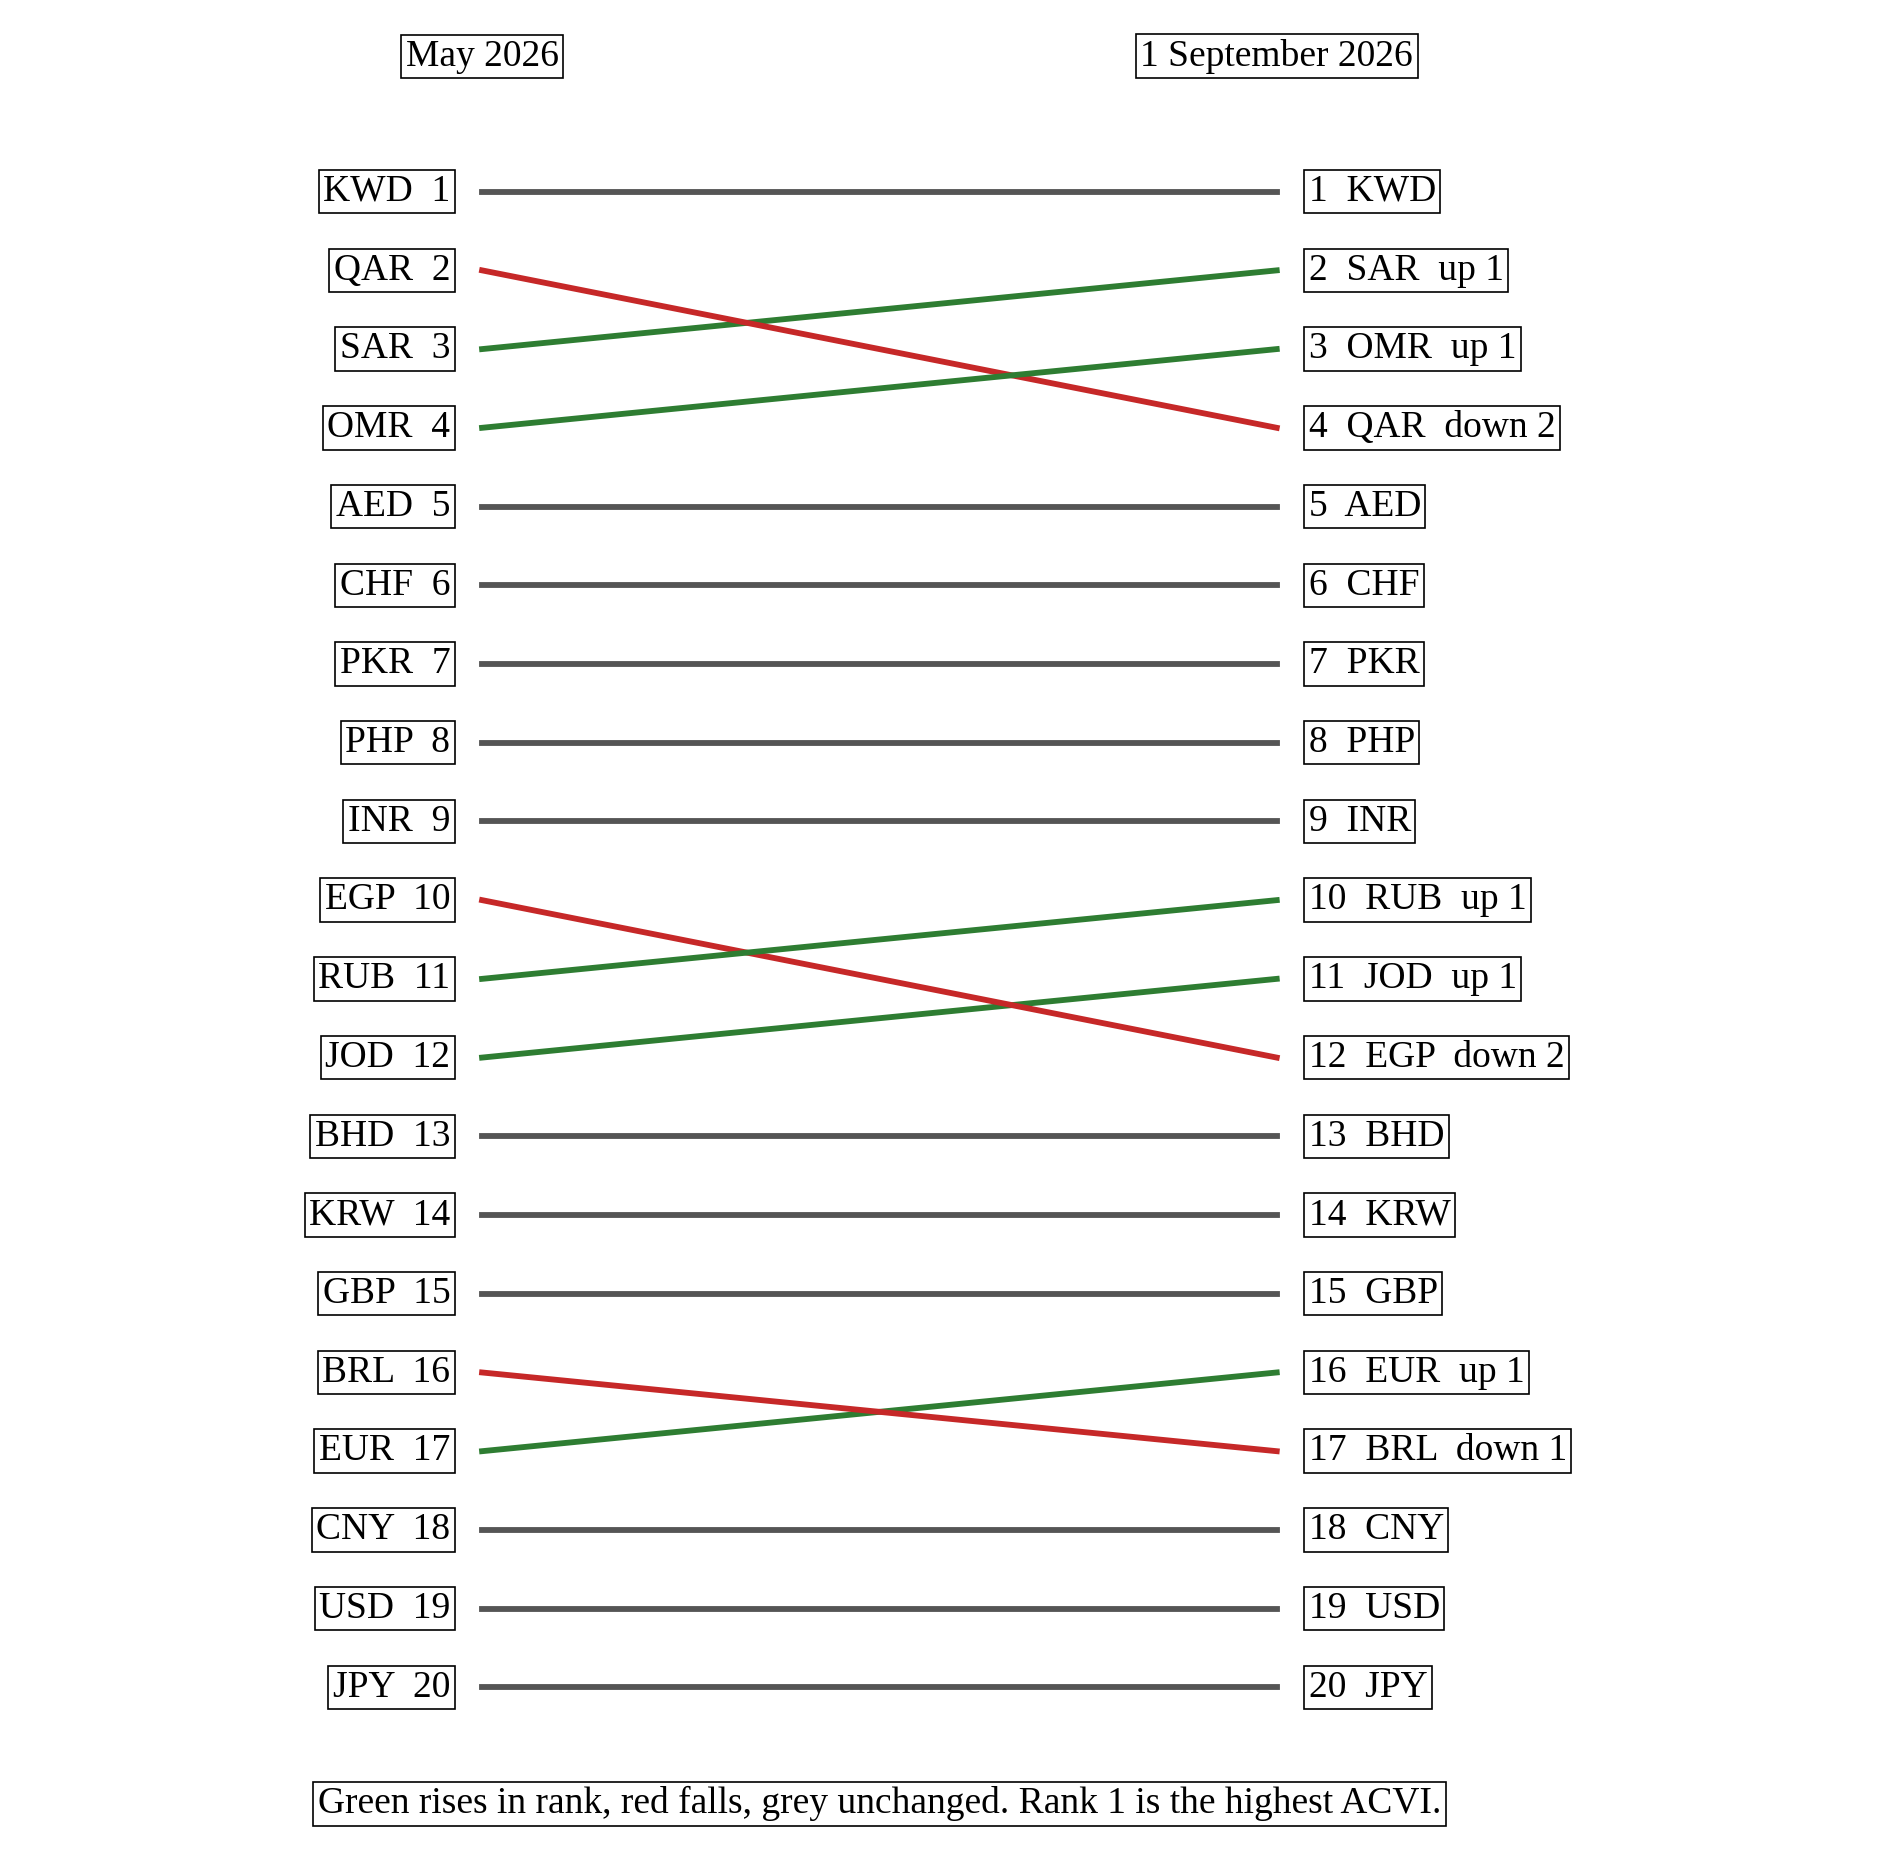
Figure 2. Rank of each currency by ACVI at May 2026 and at 1 September 2026, both on the current formula. Rank 1 is the highest.
Eight of the twenty change rank between the two columns: Saudi Arabia from 3 to 2; Qatar from 2 to 4; Oman from 4 to 3; Euro area from 17 to 16; Jordan from 12 to 11; Egypt from 10 to 12; Brazil from 16 to 17; Russia from 11 to 10. The other 12 hold their positions, Kuwait first and the yen twentieth in both columns.
| Code | Settlement | Basis | Tax | Basis | Bail-in flag | Bail-in factor |
|---|---|---|---|---|---|---|
| KWD | 1.00 | no default, full convertibility | 1.00 | no VAT | CLEAN | 1.00 |
| SAR | 1.00 | no default, full convertibility | 0.70 | VAT 15 percent | CLEAN | 1.00 |
| QAR | 1.00 | no default, full convertibility | 1.00 | no VAT in force | CLEAN | 1.00 |
| AED | 1.00 | no default, full convertibility | 0.85 | VAT 5 percent | CLEAN | 1.00 |
| OMR | 1.00 | no default, the peg held, no IMF program | 0.85 | VAT 5 percent | YELLOW | 0.85 |
| CHF | 1.00 | no default, full convertibility | 0.85 | VAT 8.1 percent | YELLOW | 0.85 |
| EUR | 0.60 | the 2012 Greek PSI haircut with ECB involvement; Cyprus senior creditors | 0.55 | VAT above 20 percent across most members | RED | 0.70 |
| GBP | 0.87 | the 1976 IMF program, the 1992 ERM exit | 0.70 | VAT 20 percent | YELLOW | 0.85 |
| INR | 0.75 | capital account not fully convertible; the 1991 IMF program | 0.70 | GST 18 percent | YELLOW | 0.85 |
| KRW | 0.87 | the 1997 IMF program | 0.70 | VAT 10 percent | YELLOW | 0.85 |
| JPY | 1.00 | no default, full convertibility | 0.70 | consumption tax 10 percent | YELLOW | 0.85 |
| CNY | 0.75 | convertibility restrictions and capital controls | 0.70 | VAT 13 percent | YELLOW | 0.85 |
| USD | 0.60 | base 0.75, the 1971 closure of the gold window and sanctions weaponization of settlement, less 0.15 systemic manipulation adjustment | 0.85 | no federal VAT; state sales taxes near 7 percent | RED | 0.20 |
| BHD | 0.87 | the 2018 GCC support package | 0.70 | VAT 10 percent | YELLOW | 0.85 |
| JOD | 0.60 | the 1989 to 1993 restructurings with haircuts, IMF programs | 0.70 | sales tax 16 percent | YELLOW | 0.85 |
| EGP | 0.75 | convertibility restrictions 2022 to 2024, managed devaluations, IMF programs | 0.70 | VAT 14 percent | RED | 0.55 |
| PKR | 0.60 | the 1999 selective default, IMF programs | 0.70 | sales tax 18 percent | YELLOW | 0.85 |
| PHP | 0.60 | the 1983 moratorium and restructuring | 0.70 | VAT 12 percent | YELLOW | 0.85 |
| BRL | 0.45 | the 1983 and 1987 external defaults | 0.40 | VAT-type taxes near 27 percent plus the IOF transaction tax | YELLOW | 0.85 |
| RUB | 0.25 | the 1998 own-currency default, the Soviet debt, the 2022 forced default | 0.40 | VAT 20 percent plus capital controls since 2022 | YELLOW | 0.85 |
Table 3. The categorical scores, common to both columns, assigned from the scales of the formula document, with the basis of each. The bail-in flags are carried from the May 2026 table and scored on the formula document's table: CLEAN 1.00; YELLOW 0.85, a framework in law never exercised; RED 0.70 for the euro, the Cyprus 2013 precedent; RED 0.20 for the dollar, the 1933 forced gold confiscation; RED 0.55 for Egypt, a precedent on large depositors.
Sources
IMF, World Economic Outlook database, April 2026. Federal Reserve, H.6 Money Stock Measures, via FRED (M2SL). European Central Bank, Statistical Data Warehouse, monetary aggregates and reference exchange rates. Swiss National Bank data portal, monetary aggregates. Saudi Central Bank, Qatar Central Bank, Central Bank of the UAE, Central Bank of Oman, Central Bank of Bahrain, Central Bank of Kuwait, Central Bank of Jordan, Central Bank of Egypt, State Bank of Pakistan, Bangko Sentral ng Pilipinas, Banco Central do Brasil, Bank of Russia, Bank of Korea, Bank of Japan, People's Bank of China, Bank of England, Reserve Bank of India: monetary statistics, July and August 2026. World Bank, World Development Indicators, broad money. IMF, International Financial Statistics, gold holdings, September 2026 edition, as compiled by the World Gold Council; State Administration of Foreign Exchange, China, August 2026. Global SWF, ranking of sovereign wealth funds, September 2026. U.S. Energy Information Administration, international proved reserves of crude oil and natural gas. SIPRI Military Expenditure Database, April 2026. Brent and Henry Hub benchmark prices at 31 August and 9 September 2026. Brent at 30 April 2026, 114.66 dollars per barrel, and at 31 August 2026, 93.03 dollars per barrel, the published benchmark quotations of those dates.
Nothing on this page is an offer, a solicitation or a public offering, or legal, financial or investment advice.
This page contains some forward-looking statements. Read Pegisai’s statement on forward-looking statements.